How to Write a Logical Framework: A Comprehensive Guide
Knowing how to write a logical framework is essential for project management, fundraising, and monitoring and evaluation success. In this comprehensive guide, we examine and explore in detail what a logical framework entails and how to develop an outstanding one.
By
Johnstone Gichoria
Business & Nonprofit Advisor
Introduction
A logical framework is a systematic and results-oriented tool that helps in planning, implementing, and evaluating projects. It provides a clear and concise overview of a project’s goals, objectives, activities, indicators, and assumptions, ensuring a logical flow of activities to achieve desired outcomes.
Historically, the logical framework was first developed by the United States Agency for International Development (USAID) in the 1970s. Today, the logframe is used by most bilateral and multilateral development agencies (e.g. USAID, DANIDA, SIDA, FCDO, EuropeAid/EU, World Bank, UNDP, and many others), as well as many international, national NGOs and partner governments. It has become the cornerstone of project design and monitoring and evaluation.
TIP: Before writing a logical framework, it is important to understand and undertake the following activities:
Stakeholder Analysis
Problem Analysis
Objectives Analysis
Strategy Analysis
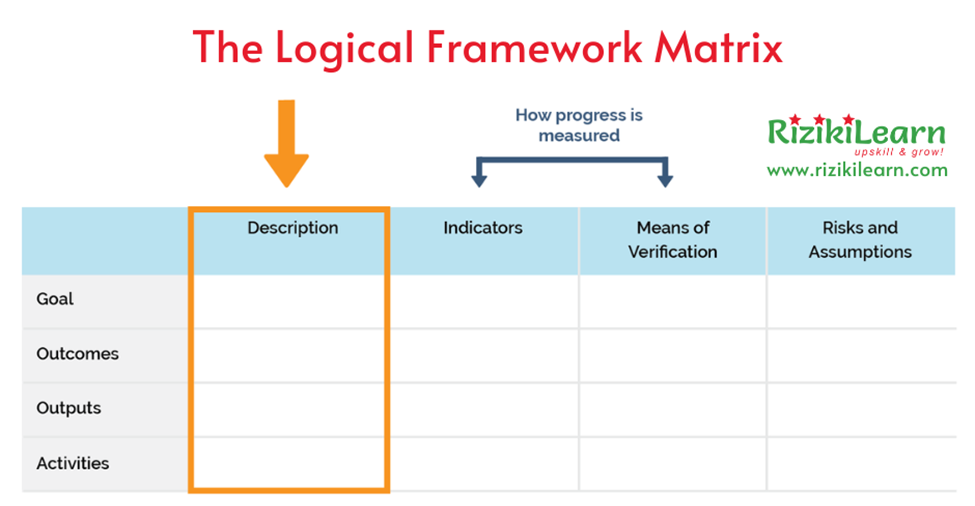
The Logframe Matrix
The logframe matrix is the core component of the logical framework. It consists of two dimensions: the horizontal logic and vertical logic. The vertical logic shows what the project intends to do, and the relationships between what will be done and what will be achieved (the ‘’means-ends chain’’), and it specifies the main assumptions. The horizontal logic defines how progress and performance will be monitored, and the sources of information for doing this.
The logical framework follows a logical sequence of thinking which starts with inputs through activities to outputs, from outputs to an outcome, and from an outcome to a goal.
Finding the right indicators for your project: The World Bank Development Indicator Database.
Part 1: Writing a Logical Framework – Vertical Logic
The first column captures the project’s development pathway or intervention logic (The project’s hierarchy of objectives) that shows how an objective or result will be achieved. Each objective or result should be explained by the objective or result immediately below.
The vertical logic of the logframe identifies what the project intends to do, clarifies the causal relationships, and specifies the important assumptions and uncertainties beyond the project’s control. A logframe typically summarizes the following in its first column: goal, outcome, outputs, and activities.
The vertical logic, also known as the means-ends chain, establishes the causal relationship between the levels in the horizontal logic. It helps ensure that the project activities are aligned with the desired outcomes.
Example:
Goal: Reduce poverty in rural communities.
Outcome: Improve agricultural productivity and income generation.
Outputs: Construct irrigation systems, provide training programs.
Activities: Conduct feasibility studies, install irrigation infrastructure, deliver training sessions.
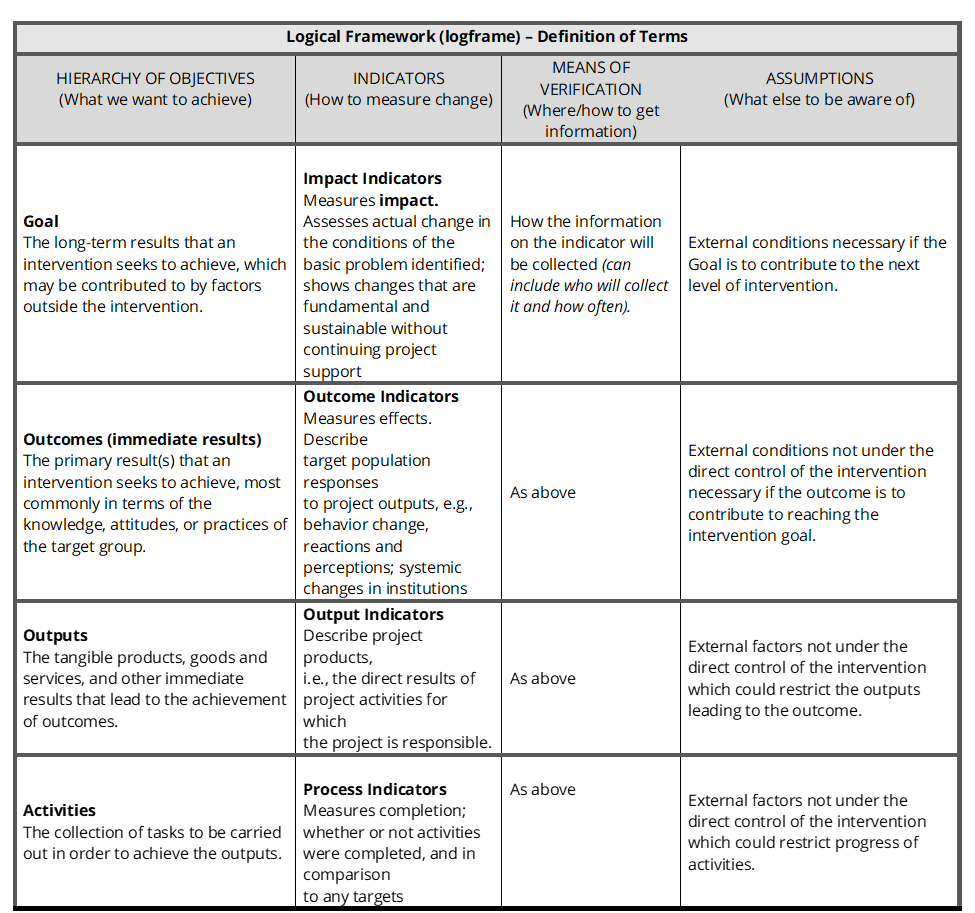
Goal
Goals are the highest-level desired end results or impacts (transformation, sustainability, livelihood, well-being, etc.) to which the project contributes (the ultimate / development objective in many logical frameworks). An example of this would be a sector-level goal or program-level outcome. Achieved project goals bring long-term change in a population’s health, economic or social status.
In our Mashinani case study, the desired future situation is to have a reduced incidence of diarrhea diseases among children under 5 and ultimately a diarrhea-free location.
This can only be achieved through sustained benefits in the long term at the outcome level i.e. continued access to adequate and safe drinking water and a culture of practicing proper hygiene and sanitation. A disease-free community will thrive socially and economically bringing about the much-needed transformation for prosperity.
Outcomes
Outcomes are what the project expects to accomplish at the beneficiary level (e.g., use of knowledge and skills in actual practice over time; transportation of goods on constructed roads over time) and contribute to population-level changes (reduced malnutrition, improved incomes, improved yields, etc.) that aggregate and help bring about the accomplishment of goals and impact over time.
Outcomes bring about change in the knowledge, attitudes, skills, intentions, or and behaviors needed of the population that contributes to the desired goal/impact.
Mashinani case study project design has two outcomes [access to adequate and safe drinking water (which can also be used for other purposes like agriculture – irrigation, livestock, etc) and improved hygiene and sanitation practices]. These two outcomes complement each other in the fight against diarrhea.
If clean water is available and people continue with improper hygiene and sanitation practices, diarrhea would still be a menace. If people only receive health education without access to adequate and clean water, they would still rely on the contaminated source of water for survival and diarrhea would still be around.
Outputs
Outputs are tangible and non-tangible deliverables resulting from project activities. They include products, goods, services, and changes (e.g., people trained with increased knowledge and skill; quality roads built) that aggregate and contribute to outcomes. Outputs are the products and services that must be in place before the outcomes can occur. The project manager and the team are held directly accountable for producing outputs that meet quality within schedule and budget.
Mashinani’s case study has 4 outputs linked to the 2 outcomes. The project manager and the team have to see to it that pumps have been built and are functioning, the local municipality staff receives training on the technical aspects, water committees are set up in every village and the health awareness campaign has reached the population. Outputs have to meet the required standards in terms of quality and serve the purpose they are created for.
Activities
Activities are tasks/actions that must be undertaken to deliver the outputs planned They are defined with action verbs: prepare, design, research, train, etc. Activities require inputs to take place.
Inputs are resources (financial, policies, personnel, facilities, space, equipment and supplies, ) required to achieve activities.
As a project manager, your primary responsibility is at the activity and output levels, as these are what you have control over at the project level.
If your vertical logic is sound and your horizontal logic (discussed in detail below) remains, you will achieve your outcome. The better the cause and effect linkages between objectives, the better the project design.
The activities (scope) have to be delivered within schedule and budget otherwise there are consequences. For instance, if pumps are built and it takes 3 months to establish water committees, there might be unregulated water access, lack of monitoring data on household water supply, etc.
Part 2: Writing a Logical Framework – Horizontal Logic
The horizontal logic is made up of the second, third, and fourth columns that contain the indicators, means/sources of verification, and assumptions respectively. Although assumptions may be seen to appear on the horizontal logic of the logframe, in reality, they are part of the vertical logic as described in the assumptions section.
The horizontal logic relates to monitoring i.e. the indicators to measure the effectiveness of the intervention, and the sources of verification for these measurements.
Indicators
Finding the right indicators for your project: The World Bank Development Indicator Database.
In the context of monitoring and evaluation, an indicator is a quantitative metric that provides information to monitor performance, measure achievement, and determine accountability (UNAIDS).
Indicators describe the project’s objectives in terms of quantity, quality, target group(s), time, and place. Indicators do not specify a particular level of achievement; words like “improved”, “increased”, or “decreased” do not belong in an indicator (UNAIDS).
Indicators describe the project’s objectives in terms of quantity, quality, target group(s), time, and place. Indicators do not specify a particular level of achievement; words like “improved”, “increased”, or “decreased” do not belong in an indicator (UNAIDS).
Indicators are designed simply to measure the change and not explain why a situation has changed or has failed to change. They are clues, signs, or markers used to provide benchmarks for demonstrating the achievements of a program. Indicators depict the extent to which a project is accomplishing its planned inputs, outputs, outcomes, and goals.
Examples of indicators: percentage of farmers adopting new technology, the ratio of female to male students attending school, the degree of quality of something, the number of products destroyed or resold, the percentage of women using birth control, etc.). Please find an extensive list of indicators here.
Finding the right indicators for your project: The World Bank Development Indicator Database.
An indicator focuses on a single aspect of a program or project. This aspect may be an input, an output, or an overarching objective, but it should be narrowly defined in a way that captures this one aspect as precisely as possible.
An indicator is both a variable and a unit of measurement. As a variable, its baseline value changes to a new value (positive or negative) at a future point in the life of a project. As a unit of measurement, an indicator is expressed as a percentage or a number.
Indicators depict the extent to which a project is accomplishing its planned inputs, outputs, outcomes, and goals. They communicate in specific, measurable terms the performance to be achieved at each level of change. Indicators also help to remove vague and imprecise statements about what can be expected from project interventions.
For the indicator to measure change i.e. the changes connected to an intervention, it must have a baseline (a measure or description of the current performance of the entity and/or a comparator) as an initial reference point.
Baselines must be defined at or near the beginning of a project. Performance during project implementation is measured against a target (the improvements, changes, or achievements expected to happen during project implementation), taking into account the baseline.
If indicators are not used carefully they can consume extensive resources and generate data with little or no value. The key challenge with indicators is to ensure their quality and integrity.
Indicators should generate data that are needed and useful. They should be technically sound. They should be understandable, practical, and feasible. In addition, they should have a proven record of performance. Each indicator must have a corresponding source of verification.
In the context of monitoring and evaluation, an indicator is a quantitative metric or a qualitative attribute that provides information to monitor performance, measure achievement, and determine accountability. a project.
Performance during project implementation is measured against a target (the improvements, changes, or achievements expected to happen during project implementation), taking into account the baseline.
Finding the right indicators for your project: The World Bank Development Indicator Database.
Steps in Developing Indicators
Step 1: Clarify the objectives Review the precise intent of the objectives and make sure you are clear on the exact changes being sought. Good indicators start with the formulation of good objectives that everyone agrees on.
Step 2: Develop a list of possible indicators Usually, many possible indicators can be readily identified. Often, it helps to develop first a long list through brainstorming or drawing on the experiences of similar projects. At this point, encourage creativity and the free flow of ideas.
Consider whether there are any indicators required by the donor, grant or program. This can be especially important if the project-level indicator is expected to roll up to a larger accountability framework at the program level.
Step 3: Assess possible indicators and select the best In selecting the final indicators, you should set a high standard. Data collection is expensive, so select only those indicators that represent the most important and basic dimensions of the results sought.
Consider secondary indicator sources. It may be cost-effective to adopt indicators for which data have been or will be collected by a government ministry, international agency, and so on.
Step 4: Apply SMART criteria on the selected indicators When developing/defining indicators, the norm is to use SMART criteria to guide performance indicator conceptualization. SMART is an acronym with the following meaning:
Specific – Indicators must be specific and focus on the change that is expected at each level. What or who is changing?
Measurable – The indicator must be quantifiable and measurable.
Can the indicator be assessed objectively and independently?
Quantitative – the expected numerical representations of what is to be achieved;
Qualitative – the narrative or pictorial description of the expected achievements;
Location – the geographic boundary of the expected achievements.
Achievable – Indicators must be attainable within the constraints of the triple constrain of project management (budget/resources, time/budget, and scope).
Relevant – Indicators must accurately measure the change the project aspires to generate. Does the indicator practical and cost-effectively measure the outputs, outcomes, and/or goal?
Time-bound – The indicator should identify a specific time and date. By when will the indicator be achieved? Can the indicator be achieved within the established timeframe?
Common mistakes made when identifying the set of indicators are:
Selection of too many indicators
Selection of overly complex indicators
Over-concentration on progress indicators
A good set of indicators should be:
SMART (as described above)
Sufficient
Sensitive to change
Cost-effective
Available
The alternative of SMART criteria is the CREAM criteria:
Clear – Precise and unambiguous
Relevant – Appropriate to the subject at hand
Economic – Available at a reasonable cost
Adequate – Provide a sufficient basis to assess performance
Monitarable – Amenable to independent validation
If any one of these five criteria are not met, formal performance indicators will suffer and be less useful. Performance indicators should be as clear, direct, and unambiguous as possible.
Type of Indicators
Input Indicators
These indicators refer to the resources needed for the implementation of an activity or intervention. Policies, human resources, materials, and financial resources are examples of input indicators.
Mashinani case study input indicators: financial and human resources to conduct training to municipality staff, salaries for project staff, conduct hygiene and sanitation campaign, purchase materials – pumps, concrete, etc
Process and Output Indicators
Process indicators refer to indicators to measure whether planned activities took place. Examples include holding of meetings, conduct of training courses, distribution of medicines, development, and testing of health education materials.
Output indicators add more details in relation to the output. In our case study, output indicators are the number of pumps built and functioning, number of municipality staff trained on technical maintenance of the pumps, percentage of the population reached by the awareness campaign, and number of established and functional water committees in the location.
Process and output indicators should also monitor the quality of the activities conducted, based on a number of established quality criteria or standards. For instance, in Mashinani, indicators to monitor the quality of the technical training course for municipality staff may include the ratio of facilitator to the participant, the total duration of the training, the percentage of total training time spent practicing the technical skills, the proportion of participants trained that were followed up with skill reinforcement visits within 4 weeks of training, etc.
These indicators are useful management tools to monitor implementation and its quality. However, they do not provide information on the results and impact of the activity.
Outcome Indicators
Outcome indicators refer more specifically to the objectives of an intervention, that is its ‘results’, its outcome. These indicators refer to the reason why it was decided to conduct certain interventions in the first place. They are the result of both the “quantity” (“how many”) and the quality (“how well”) of the activities implemented.
Examples: the proportion of under-five children with suspected pneumonia treated with antibiotics, the proportion of under-five children with diarrhea given oral rehydration therapy, the proportion of infants 0-5 months old who are exclusively breastfed. Mashinani case study outcome level has 4 indicators. Outcome indicators allow us to know whether the desired outcome has been generated.
Impact Indicators
Impact indicators measure and track the change that occurred as a result of your intervention. They show if the goals you set out to achieve have been achieved or if your intervention is making progress towards the goals. Also, they show & communicate the impact created to stakeholders & donors.
In our case study, impact indicators refer to the health status of the target population: reduction in diarrhea diseases among children under 5 and consequently, reduction in child mortality, reduction in child morbidity, and improved child nutritional status. These indicators do not show progress over relatively short periods of time.
Finding the right indicators for your project: The World Bank Development Indicator Database.
Indicator Disaggregation
Indicator disaggregation is a way of breaking down the indicators into categories for a more robust analysis. Indicators can be disaggregated by gender, geographic location, socio-economic status, age group, etc.
Disaggregation is intended to provide a better understanding of the changes happening at the level of each category. The disaggregation will depend on the indicator and what kind of information is required for a deeper analysis.
In the Mashinani case study, the number of municipality staff trained in the technical training course could be disaggregated by sex, age, and level of education. Ditto for water committee members. This will allow for deeper analysis and correction where need be.
Characteristics of Indicators
A good indicator should:
produce the same results when used repeatedly to measure the same condition or event;
measure only the condition or event it is intended to measure;
reflect changes in the state or condition over time;
represent reasonable measurement costs; and
Be defined in unambiguous terms.
Indicators should be consistent with international standards and other reporting requirements. Examples of internationally recognized standardized indicators are the Sustainable Development Goals indicators.
Indicators should be independent, meaning that they are non-directional and can vary in any direction. For instance, an indicator should measure the number of clients receiving counseling rather than an increase in the number of clients receiving counseling. Similarly, the contraceptive prevalence rate should be measured, rather than the decrease in contraceptive prevalence.
Indicator values should be easy to interpret and explain, timely, precise, valid, and reliable. They should also be comparable across relevant population groups, geography, and other program factors.
Quality of Indicator
The quality of indicators is determined by five main factors (relevance, validity, reliability, cost-effectiveness, credibility):
Quality of the logical link between the indicator and what is being measured (relevance).
What is being measured and why?
What are the potential indicators?
Why does/do the indicator(s) measure the objective, outcome, output and/or impact?
How does the indicator measure the objective, outcome, output and/or impact?
Quality of the measurement
Are the indicators measuring what they are designed to measure (validity)?
Do the indicators provide the same results when the measurements are repeated (reliability)?
Quality of implementation
Are the financial costs of measuring the indicators worth the information to be collected (cost-effectiveness)?
Quality of recognizing the measurement results and their interpretation.
To what extent are the measurement results and their interpretation accepted as a basis for decision-making by those involved (credibility)?
Sources of Verification
Sources of verification are the sources from which we get the information to measure our indicators. For example, body temperature is an indicator of health. A thermometer (source) provides the evidence.
Sources of verification should be cost-effective and should directly measure the indicators. SOV should be kept simple. The more complex the indicator, the more complex and subsequently, challenging to measure.
The SOV should be considered and specified at the same time as the formulation of the indicator. This will help to test whether or not the indicator can be realistically measured within a reasonable amount of time, money, and effort.
The SOV should specify:
How the information will be collected (e.g. from administrative records, special studies, sample surveys, observation, etc.) and/or the available documented source (e.g. progress reports, project accounts, official statistics, completion certificates, etc.)
Who will collect/provide the information (e.g. contracted survey teams, the district health office, the project management team)
When/how regularly the information will be provided (e.g. monthly, quarterly, annually, etc.
Assumptions
Finding the right indicators for your project: The World Bank Development Indicator Database.
Assumptions are factors or variables that need to be in place for a specific result to be achieved. If the assumptions hold true, the expectation is that the results will be achieved. They form an important part of the chain of results cause-effect logic.
Assumptions are always stated positively as though they are in place, for example, that a condition will be met or a requirement will be in place. The probability and significance of each assumption being met should be estimated as part of assessing the feasibility/riskiness of the project.
Whereas assumptions are positive statements about the conditions that need to be met if the project is to stay on track and succeed, risks are negative statements about what might go wrong.
Assumptions appear on the horizontal column of the logframe but they contribute to the vertical logic because it is until they are met (IF-THEN relationship) that the next level of objectives will be achieved.
Goal + Assumptions = Vision
Outcomes + Assumptions = Goal
Outputs + Assumptions = Outcomes
Activity + Assumptions = Outputs
Killer Assumption
Killer assumptions are important assumptions that are likely to fail, and that cannot be brought under the control or influence of the project. With a killer assumption, the probability of assumption failing and the impact of that failure on the project/program is high.
Killer assumptions are red flags, indicating that the project may not be viable and should be refocused or dropped or the project should undergo a significant redesign.
In our case study, a killer assumption would be that the groundwater is adequate and safe for consumption. If it’s very unlikely that the assumption will hold true, then the project cannot continue as designed. We’d have to explore alternatives like getting piped water – which may be expensive and difficult to operationalize.
Counter-Checking The Logical Framework
When the logframe has been filled in, recheck it to make sure it is logical.
Hierarchy of Objectives
All outputs define tangible products or services
All outcomes describe immediate and direct effects of outputs
Objectives are stated clearly and logically linked to the objective on the next level up
The project will be able to make a considerable contribution to the goal or impact assessment
Assumptions
All assumptions are external factors
All important risks are considered and formulated as assumptions
All assumptions are probable and there are no “killer” assumptions
Indicators
Each result has at least one measurable indicator
All indicators measure relevant aspects of the specific results
None of the indicators could be omitted or replaced by a more relevant one
The indicators and evidence are reliable and accessible
All indicators can measure the progress and impact of the objectives
Indicators and evidence can be used for monitoring and evaluation
Means/Sources of Verification
The source of information for each indicator is clearly defined
Verification of data relies mainly on already existing mechanisms and resources
An adequate budget is availed for data gathering and processing
Application of the Logical Framework
Logframes are useful for both new and existing projects and initiatives. For new projects, it’s a synopsis of your project design while for ongoing ones it helps to describe, modify or enhance the project. Logframes are applied by many development organizations/agencies and are incorporated in their project formulation approach.
A logframe brings about improvements in project design, proposal development, implementation, and management and facilitates improved project monitoring and evaluation. It’s worth noting that a logframe is a living document and should be updated if any changes are made in the project and through consultation and appropriate approval and justification processes.
align your efforts with those of other organizations
develop a proposal or a request for proposals
assess the potential effectiveness of an approach
During the planning phase to:
develop a management plan
set priorities for allocating resources
estimate timelines
identify necessary partnerships
negotiate roles and responsibilities
focus discussions and make planning time more efficient
During the implementation phase to:
provide an inventory of what you have and what you need to operate the program or initiative
incorporate findings from research and demonstration projects
make mid-course adjustments
reduce or avoid unintended effects
During staff and stakeholder orientation to:
explain how the overall program works
show how different people can work together
define what each person is expected to do
indicate how one would know if the project/program is working
During fundraising to:
justify why the program will work
explain how resource investments will be used
During evaluation phase to:
document accomplishments
organize evidence about the program
identify differences between the ideal project/program and its real operation
determine which concepts will (and will not) be measured
frame evaluation questions about attribution (of cause and effect) and contribution (of initiative components to the outcomes)
specify the nature of questions being asked
prepare reports and other media
tell the story of the project/program or initiative
Logical Framework Strengths and Weaknesses
Strengths
Accountability
It draws together all key components of a planned activity into a clear set of statements to provide a convenient overview of a project.
It sets up a framework for monitoring and evaluation where planned and actual results can be compared.
It anticipates project implementation and helps plan out development activities.
Weaknesses
It may cause rigidity in program/project management.
It is not a substitute for other technical, economic, social, and environmental analyses.
It can stifle innovative thinking and adaptive management.
It often requires data that is sometimes difficult to obtain
Best Practices for Developing a Logical Framework
To ensure the effectiveness of your logical framework, it is crucial to follow key principles and guidelines during the writing process. By incorporating these best practices, you can enhance the clarity, coherence, and usefulness of your logical framework. Here are some key principles and guidelines to consider:
Stakeholder Involvement: Engage relevant stakeholders throughout the process to gather insights, perspectives, and ensure a shared understanding of project goals and outcomes.
SMART Objectives: Set Specific, Measurable, Achievable, Relevant, and Time-bound (SMART) objectives that clearly define the desired outcomes of the project.
Well-Defined Indicators: Choose appropriate indicators that align with project objectives and provide measurable evidence of progress and success.
Clear Activities and Outputs: Define activities and outputs that directly contribute to achieving the desired outcomes. Ensure they are realistic, feasible, and well-aligned with the project’s purpose.
Address Assumptions and Risks: Identify and address assumptions and risks that may impact the project’s success. Develop contingency plans and strategies to mitigate potential challenges.
Regular Monitoring and Evaluation: Establish a robust monitoring and evaluation framework to track progress, identify deviations, and make informed decisions for effective project management.
Common Mistakes to Avoid
Lack of Clarity: When writing your logical framework, ensure all elements of the logical framework are clear, concise, and easily understood by all stakeholders.
Overcomplicating the Matrix: Keep the logframe matrix simple and focused, avoiding unnecessary complexity.
Neglecting Monitoring and Evaluation: Incorporate a robust monitoring and evaluation plan to track progress, learn from experiences, and make necessary adjustments.
Failure to Review and Update: Regularly review and update the logical framework throughout the project lifecycle to adapt to changing circumstances and improve project outcomes.
Frequently Asked Questions
What are the key elements of a logical framework?
The key elements of a logical framework include the goal, purpose, outputs, activities, indicators, assumptions, and risks. These elements help structure the project’s objectives, activities, and outcomes, ensuring a logical flow of activities to achieve the desired impact.
Can a logical framework be used for any type of project?
Yes, the logical framework can be used for a wide range of projects in various sectors, including development projects, humanitarian initiatives, infrastructure development, education programs, healthcare interventions, and more. Its adaptable nature makes it a versatile tool for project management.
How do I ensure the logframe aligns with the project’s theory of change?
To ensure alignment between the logical framework and the project’s theory of change, start by clearly understanding the theory of change, which outlines the causal relationships and assumptions underlying the project. Then, incorporate these elements into the logical framework’s horizontal and vertical logic. Regularly review and refine the logframe to maintain consistency with the theory of change as the project progresses.
What role does the logframe play in grant applications?
The logical framework is often an essential component of grant applications. It helps grant makers understand the project’s goals, objectives, activities, and expected outcomes. By including a well-developed logical framework, you demonstrate your project’s feasibility, clarity, and alignment with the funder’s priorities. It showcases your ability to effectively plan, implement, and evaluate the project, increasing the chances of securing funding.
How can I ensure the logical framework remains flexible during project implementation?
To maintain flexibility, regularly review and update the logical framework as the project progresses. This allows you to adapt to changing circumstances, incorporate lessons learned, and make necessary adjustments to keep the project on track. It is important to strike a balance between flexibility and adherence to the project’s overall goals and objectives.
How can I effectively identify and define project indicators?
When identifying and defining project indicators, follow the SMART principle: Specific, Measurable, Achievable, Relevant, and Time-bound. Ensure that each indicator is clearly defined, quantifiable, and directly linked to the project’s objectives. It is also important to choose indicators that are practical to measure and provide meaningful insights into project progress and outcomes.
What is the role of assumptions in a logical framework?
Assumptions in a logical framework are the external factors or conditions that need to be in place for the project to be successful. They represent the risks and uncertainties that may impact the project’s implementation and outcomes. Identifying and documenting assumptions helps project managers and stakeholders understand potential challenges and devise strategies to mitigate them.
How can I involve stakeholders in this process?
Stakeholder involvement is crucial for developing a comprehensive and effective logical framework. Engage stakeholders through consultations, workshops, and meetings to gather their input, insights, and expectations. This ensures a shared understanding of the project’s objectives, enhances ownership, and increases the likelihood of project success.
Conclusion
Mastering this skill is essential for effective project management, fundraising and monitoring and evaluation in the development sector. By understanding the components, following best practices, and avoiding common mistakes, you can develop a logframe that serves as a powerful tool for planning, implementing, and evaluating projects.
Remember to involve stakeholders throughout the process, set SMART objectives, define clear indicators and outputs, address assumptions and risks, and establish a robust monitoring and evaluation framework. Regularly review and update the logframe as the project progresses to maintain its relevance and adapt to changing circumstances.
It takes careful thought, attention to detail, and a focus on outcomes and impact to develop a good logframe. By incorporating these practices, you can enhance project planning, increase accountability, and improve the chances of project success.
As you embark on your journey, remember that this is not only a document but also a dynamic tool that guides project implementation and evaluation. Continuously refine your approach, seek feedback from stakeholders, and learn from each project iteration to enhance your skills and contribute to positive change in the development sector.
With a well-crafted logical framework, you can effectively communicate project goals, align activities with desired outcomes, and drive meaningful impact in the communities and causes you serve.
Enroll in our Project Management ONLINE Course – learn at your own pace!
Knowledge is power, and learning is a continuous process. I am happy to have gained critical insights on creating and applying a Logical Framework.